The topic This free Windows app turns your RAM usage graph into something actually readable is currently the subject of lively discussion — readers and analysts are keeping a close eye on developments.
This is taking place in a dynamic environment: companies’ decisions and competitors’ reactions can quickly change the picture.
There are times when you might notice the Task Manager tab showing your RAM usage at almost full levels, with no obvious culprit in the process list. The graph may be moving, but it’s not telling you anything useful.
Enter RAMMap, a free, portable tool from Microsoft’s Sysinternals suite that replaces that ambiguous dashboard with a full breakdown of every memory allocation type on the system, whether it’s active, standby, caches, driver-locked, file-mapped, or more. It only takes a quick 30 seconds to download and run, needs no installation, and the first tab alone will probably help you see deeper into your RAM usage than you thought you could see.
Task Manager’s Memory tab (in Performance) shows a single stacked graph of RAM in use, committed, cached, and paged/non-paged. It looks detailed, but really just collapses all the data into one visual. It’s essentially hiding what’s actually using the RAM on your PC. Resource Monitor can add a little more insight (Working Set, Private, Shareable columns per process), but still won’t tell you if it’s a driver, NTFS metadata issue, or file cache that’s consuming your memory.
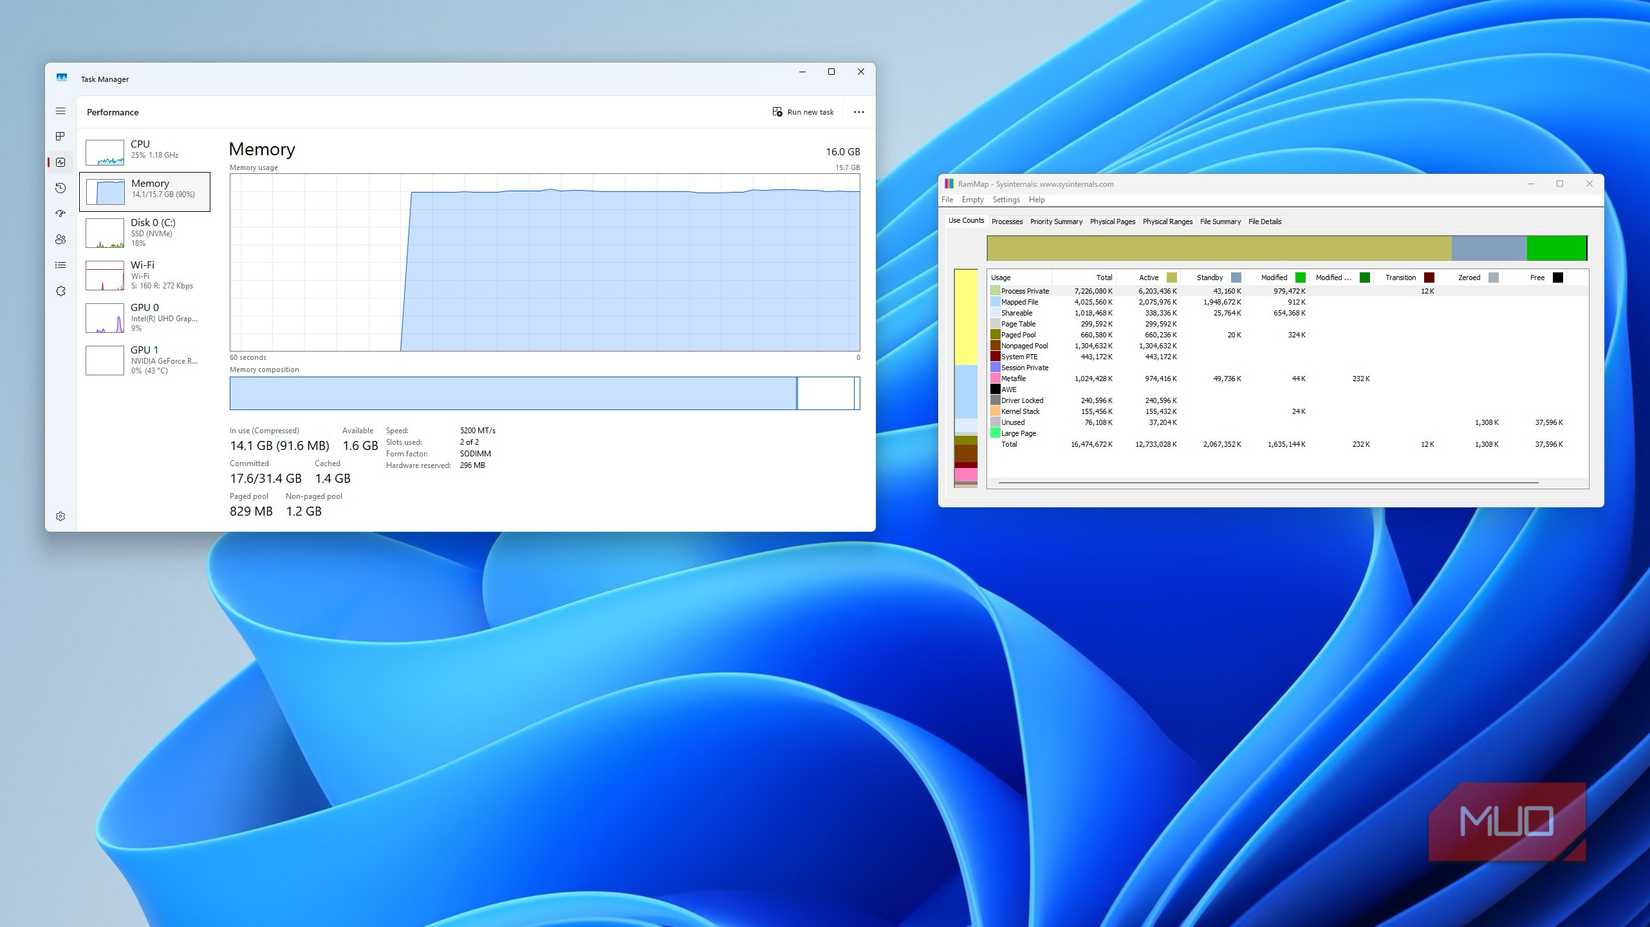
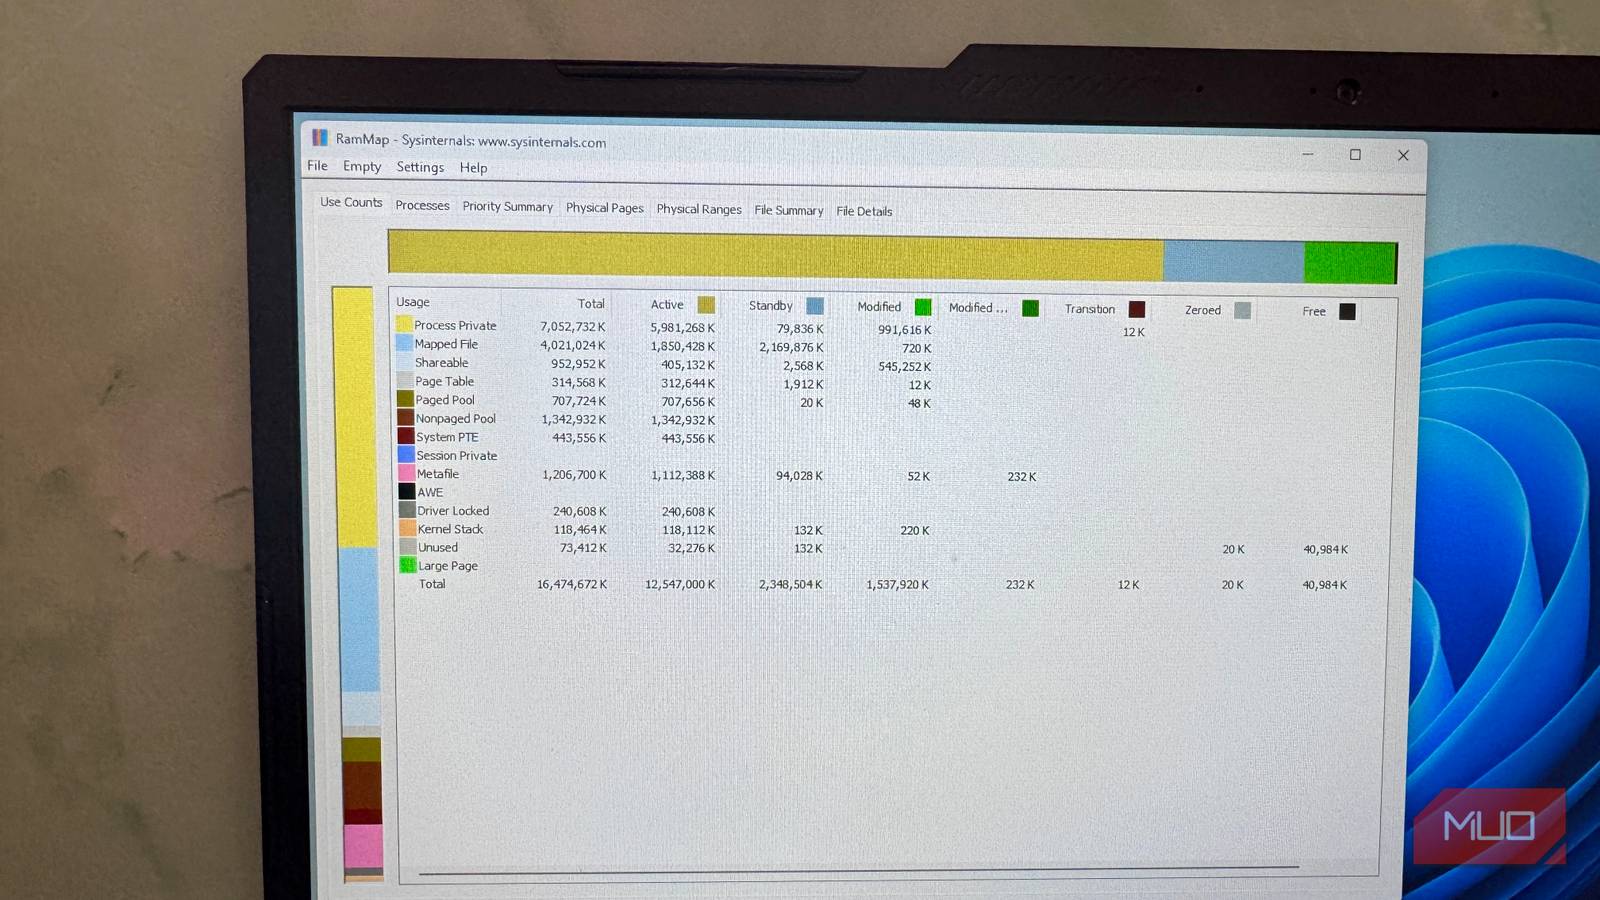
RAMMap is free and easy to download and use; it just requires admin rights on your PC. The Use Counts tab is where the magic is: instead of one Task Manager-style bar, you get a full matrix of the types of Memory use on your machine: Process Private, Mapped File, Page Table, system, Driver Locked, Metafile, Kernel Stack, etc. Plus, each type is broken out by Active, Standby, Modified, and Free state. Suddenly, the graph in Task Manager becomes a table in RAMMap and you can see that your ram isn’t being eaten by apps, for example, but by Metafile (NTFS metadata cache) or Standby (data Windows is holding in reserve).
You should only download RAMmap from the official Microsoft Sysinternals page below. Third-party mirrors are a risk.
RAMMap is a free Sysinternals tool that provides a detailed breakdown of how Windows allocates physical memory, showing usage by processes, files, drivers, and the kernel.
There are seven tabs that RAMMap shows you, with the following important ones that you’ll want to take a look at first.
Use Counts is where you might find your first aha moment. The color bar graph at the top maps your RAM to a category of Active, Standby, Modified, Free (and a few others), so you can see where your memory is going at a glance. The table below breaks it all down numerically by type. Standby memory isn’t wasted RAM, it’s just cached files and data that Windows has preloaded because you’ve used them recently. It can easily be reclaimed by your system if it’s needed once an active process needs the space. If your available RAM looks low in Task Manager, but you see a lot in Standby here, you know that your machine is acting as it should.
The Processes tab should look familiar if you’ve spent time in Task Manager, but instead of a Working Set figure per process, RAMMap splits each one into Private, or memory that belongs only to that process, Standby, or cached pages that the process has used), Modified, or pages that have been written but not yet flushed, and Page Table, or the overhead tracking. A large Working Set number in Task Manager could be mostly Standby, which is easily reassigned, so not a big problem. If, however, the Private number is big, that’s committed RAM that a process won’t let go of.
The File Summary tab, then, lists every file mapped into RAM by full path (executables, DLLs, data files) with Active, Standby, and Modified columns broken out for each. If something is holding RAM it shouldn’t be. This is where you find out what it is and why. The Modified column is the one to watch: a high value means that file has been written to memory but not yet flushed to disk, so Windows can’t free that RAM until it does.
RAMMap’s Empty menu is one interactive feature I was tempted to mess with. It’s got four options, one of which is really the safest option for general use: Empty Standby List. This command reclaims memory that Windows has set aside as a cache for recently used files and hands it back to the system if something needs it. Windows will rebuild the cache after the command, there may be a slight slowdown for a few seconds.
Don’t use Empty Working Sets, as it forces currently running apps to unload their active memory pages, which could cause lag, freezes, or even crashes.
Empty Modified Page List will force all pending RAM writes to flush to disk immediately and then moves those pages to Standby. It can cause a brief I/O spike, but it can be useful if your Modified column in RAMMap is oddly high and you think backed-up writes are the issue. Other than that, leave this one alone, too.
Empty system Working Set does the same thing as Empty Working Sets, but only targets the system file cache, leaving application memory untouched. To be safe, outside of specific server or driver diagnostics, leave this one alone, too.
Using RAMMap can be useful to track down memory issues, but it’s not part of a regular maintenance routine. On a healthy system, high RAM usage is fine, as Windows is designed to use what’s available. You’ll only need to pull out this app when something feels off and Task Manager doesn’t tell you why.